
Interest rates may be important, but that doesn’t make them easy to measure.
Interest rates have long been a concern for policymakers and
households alike. Indian States began regulating the interest rates charged by
moneylenders as early as the 1940 Bengal Moneylenders Act, which placed strict
upper limits on the interest rates that lenders could charge.[1]
Interest rates are also limited for more formal lenders; the Reserve Bank of
India may have removed the cap of 26% interest rates on microfinance loans, but
MFIs are still regulated in what they are allowed to charge.[2]
Regulations regarding interest rates come out of concerns
that households are being taken advantage of by lenders. Without caps on the
market, households may be too desperate - or may not understand finances well
enough - and ultimately pay a steep price for funds. Conversely, lenders argue
that particularly in areas where lending is risky, the cost of doing business
is so high that capping interest rates prevents them from transacting at all.
The complexity of interest rates makes them particularly
difficult to understand, particularly from a household’s perspective;
converting from a declining balance interest rate to a simple interest rate is
a complex affair, involving the precise number of payments. Interest rates for
loans of different lengths are also not directly comparable without additional
calculations. In practice, it is hard to expect households to know whether a
loan is competitively priced on its face.
As researchers, we also struggle with the question of
understanding interest rates. When studying financial inclusion, accurately
capturing interest rates is of paramount importance, but also uniquely
difficult. In rural India, households borrow not only from formal banks, cooperative
banks or microfinance institutions, which tend to have rigidly structured
loans, but from self-help groups, moneylenders, pawn brokers, and even friends
and neighbors, whose loans tend to be much less structured, and much less
formal. Researchers are tasked with not only finding ways to compare these
interest rates, but with doing so by gathering information from households,
who, although they tend to have an excellent sense of their own financial
situation, may not be able to describe their interest rates in technical terms.
Interest Rates in the
Field: Piloting in Tamil Nadu
Last spring, in the context of a broader study on financial
inclusion in rural Tamil Nadu, we piloted and compared three different ways of
capturing interest rates in a household survey, to try and understand what
sorts of questions would elicit the most accurate responses from households.
The first two
methods of calculating the interest rate followed the same approximate pattern -
first, calculate the total amount which will be repaid over the life cycle of
loan, then calculate the percent difference between that and the principle
amount. The goal is to estimate the interest rate without asking highly
technical questions or constructing complex interest rate equivalences.
In the first method,
the household is asked directly about the total amount they repay; in the
second method, the amount is constructed based on the household’s answers to
questions about the loan structure and their payments. The third method instead
asks for a direct measure of the interest rate, i.e. “On Rs. 100 borrowed, what
is the amount of interest you have to pay?” Although this method is not
sophisticated in terms of distinguishing between structures or types of
interests, we use it to treat the self-reported measure of interest as a crude
measure of the actual interest rate.
The pilot was
conducted in a semi-urban area outside of a large city in central Tamil Nadu.
Over the course of several days, 81 households were interviewed, reporting a
total of 234 loans.
Table 1: Loans by Lenders
Lender
|
Number
|
Percent
|
Private Bank
|
6
|
2.6%
|
NGO/MFI
|
58
|
24.8%
|
Nationalized Bank
|
38
|
16.2%
|
Primary
Agricultural Cooperative (PAC)
|
22
|
9.4%
|
Friend/Neighbor/Relative
|
25
|
10.7%
|
Moneylender
|
16
|
6.8%
|
Pawn Broker
|
34
|
14.5%
|
SHG
|
14
|
6.0%
|
ROSCAS
|
4
|
1.7%
|
Non-Banking
Financial Corporation (NBFC)
|
13
|
5.6%
|
Lender Not
Reported
|
4
|
1.7%
|
Total
|
234
|
100.0%
|
Loans from
microfinance institutions were the most common, comprising a quarter of the
total loans reported. Households also reported a substantial proportion of
loans from nationalized banks and pawn brokers, and, decreasingly, from
friends, neighbors and relatives and from primary agricultural cooperatives. Private
bank loans, despite the proximity of this area to a fairly large city, were
relatively uncommon within the sample, as well loans from ROSCAS (rotating
savings and credit associations).
Table 2: Loans by Loan Type
Loan Type
|
Number
|
Percent
|
JLG Loan
|
87
|
37.2%
|
Land Loan
|
13
|
5.6%
|
Jewelry Loan
|
83
|
35.5%
|
Other
|
51
|
21.8%
|
Total
|
234
|
100.0%
|
Joint lending group
loans (the classic MFI or SHG loan) and jewel loans made up over 70% of the
sample. As one would expect, the majority of JLG loans - nearly 90% - were
reported as from microfinance institutions, non-banking financial corporations
or self-help groups. Most of the rest of the loans reported did not require
collateral, although a small percentage of households reported that they were
required to provide land as collateral for their loans.[3]
Following the
conclusion of the pilot, interest rates were calculated for each of the three
methods for each reported loan. We then looked, for example, at whether the
three methods of calculation agreed for the loan, and how the interest rates
broke down by different lenders and types of loans.
Figure 1: Interest Rates by Lenders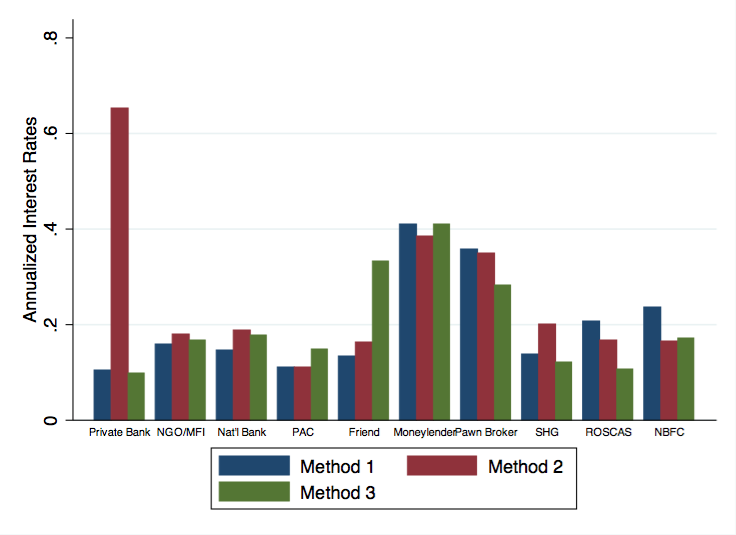
Consistently, across
all three methods, the highest interest rates were reported from loans from
moneylenders and pawn brokers. Correspondingly, although the figure is not
included, joint lending group loans tended to have lower interest rates than
jewelry loans and unsecured loans both. The only exception was the interest
rates calculated via Method 2 (which asks about loan structure, and uses
repayment frequency and repayment size to calculate the total amount which the
respondent will repay) for private bank loans. This - and informal observation
during the survey process - suggests that in the case of formal loans,
respondents often struggle to reproduce precisely their loan schedule, but do
have a good sense, overall, of the cost of the loan and the interest rate which
they are required to pay.
How does
understanding the extent to which self-reported interest rates are accurate and
internally consistent contribute to the broader debate about financial
inclusion in India? Outside of its obvious relevance in research and impact
evaluation, the results of this pilot suggest - tentatively - that, at least
when assisted by surveyors, relatively low-income rural respondents, the majority
of whom had little to no financial literacy training, were relatively
accurately able to report on the interest rates they faced. Respondents could
not necessarily describe their loans in technical terms; they did not necessarily
know precisely their annual percentage rate, or any of the other statistics
used by financial corporations. However, we found that respondents knew what
they would be required to pay back in total, and knew whether a loan was a good
or bad deal. In short, they did have a good sense of how much they were paying
for the money that they had borrowed.
We can’t conclude
from this that interest rates don’t need regulation, and the results of the
pilot don’t address the constraints that households face when there are few
lenders to be found. That being said, the results are encouraging; as financial
inclusion improves in rural India, and as households have the opportunity to
borrow from a wider range of lenders, this pilot suggests they will do so with
a practical, if not technical, understanding of the interest rates they face.
[1] The Bengal Money-Lenders Act, 1940, Chapter VI,
Interest and other charges, p. 16
http://www.wbrsrsa.org/exam_pdf/Bengal%20Money-Lenders%20Act,%201940.pdf
[2]
http://articles.economictimes.indiatimes.com/2014-02-08/news/47127322_1_margin-cap-lending-rate-interest-rate
[3] Households reported being required to provide land as
collateral for a range of loans, from private banks, nationalized banks,
primary agricultural cooperatives, friends, neighbors, relatives and
moneylenders; we remain somewhat skeptical as to the accuracy of this
reporting.
Comments
Post a Comment